
The COMESEP alert system user interface is divided into three parts:
- the upper part shows a summary of the active alerts,
- the middle part is a legend describing the icons displayed,
- the bottom part is the timeline frame.
Registering for COMESEP alerts and the disclaimer are provided at the bottom of the display.
Summary frame
The summary frame is a table that contains information about each impact type:
-
Geomagnetic storm alert
- SEP proton storm alert >10 MeV
- SEP proton storm alert >60 MeV
The second column shows the reception time of the last active alert that was issued. If no active alert is available, it states “no alert since X days” or “no alert occurred”.
The last column gives additional information about the active alerts.
An alert is considered active when:
- The alert includes an estimation of the impact risk.
- The event will happen in the future or ended no longer than six hours ago.
- The event is observed at the Sun or expected to target the Earth.
- The alert is not obsolete (i.e. an alert is obsolete when one of its ancestors is updated or deleted, but this alert is not yet updated).
Timeline frame
The control bar
|
|
The refresh button shows you all alerts, including those who arrived since the last reload. Alerts happening in the past month are refreshed automatically. |
|
|
The date picker defines the date that is shown in the middle of the timeline. |
|
|
The zoom level sets the range of the timeline. |
|
|
Receive COMESEP alerts by email |
|
|
Go to the COMESEP home screen |
|
|
Show this help window |


The timeline
Each tool that is integrated in the system could generate alerts. Most of the tools will only be visible as a star in the user interface, but the tools that calculate an impact risk will also be shown as bars (or circles when the length of the alert is too short with respect to the scale on the timeline). The start of the bar indicates the earliest time that the impact could happen and the end of the bar indicates the latest time that the impact is expected. The colour of the bar indicates the impact risk.
The risk level is the combination of the impact or magnitude of the event and the likelihood of occurrence. The colour scheme is explained in the figure hereunder.
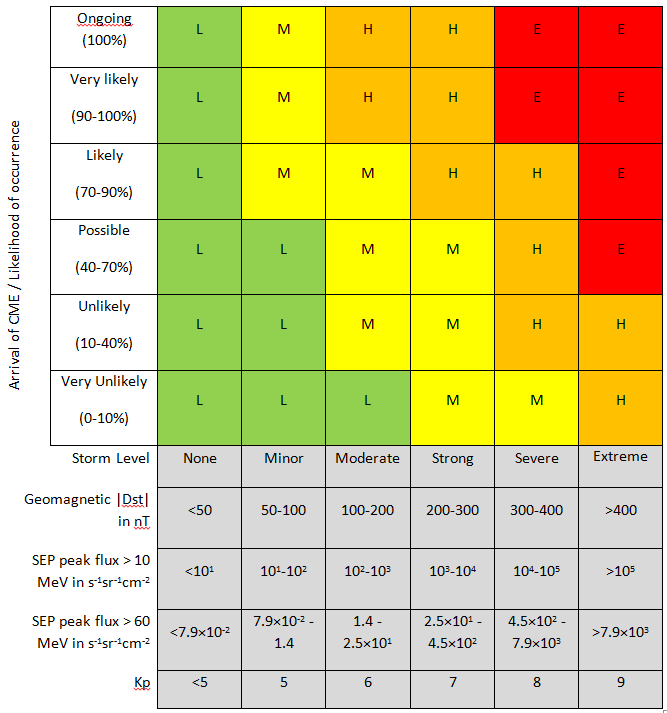
Risk matrix used to estimate geomagnetic storm and SEP storm risk levels in the COMESEP alert system.
L stands for low, M for medium, H for high and E for extreme risk.
When you hover with your cursor over an alert, a popup shows some basic information about this alert. When you click on an alert, you see a popup with additional information. In the example hereunder you see a CGFT (CME geomagnetic forecast tool) alert.
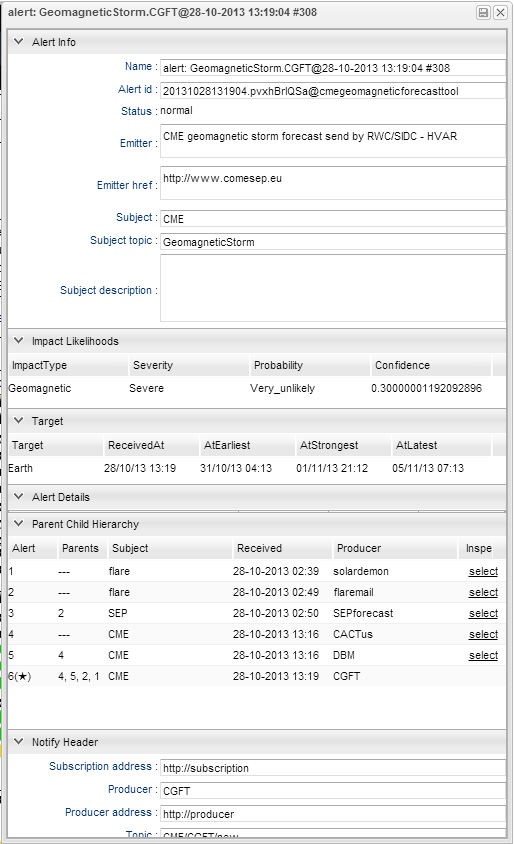
Example of the details popup for a CGFT (CME geomagnetic forecast tool) alert.
The details popup has six parts:
- Alert info: alert id, the emitter (alert producer), …
- Impact likelihoods: Impact type, severity (impact/magnitude/storm level), probability, confidence
- Target: the timing of the event at a specified target (e.g. the Earth). The earliest, strongest and latest timing are given
- Alert details: tool specific part of the alert
- Parent/child hierarchy: a list of the parent alerts used by the tool to generate this alert
- Notify header: this part contains technical information.